OK, let’s assume you’ve gotten great at picking the right projects to do to benefit the company. How do you know you can actually accomplish the ones you’ve picked with the resources you have? If you’re like most companies I’ve seen, it’s done on a wing and a prayer. But there’s a better way.
Last time, I wrote about ways to pick projects that satisfy the company’s “SHOULD do” dimension: ones that are strategic, financially beneficial, risk mitigating, or legally mandated, for example. I set out practical guidelines for the process of selection in that dimension, to ensure as level a playing field as is possible. And I left it for this follow-on post to discuss prioritization from the perspective of the other dimension, the “CAN do” dimension, which needs to calibrate the list of chosen projects to what can actually be accomplished by the available resources.
Both dimensions inform each other, of course; they’re not independent or sequential. In other words, the company might be able to tackle five smaller projects rather than one huge project, and figuring out if it’s a good idea to actually make that trade-off will be based on executive judgment of the benefits in both scenarios.
In “practical CIO” terms, though, the SHOULD do dimension has the rather unfortunate trait of being a challenge to automate or model, especially fuzzier aspects of proposed projects such as risk or strategy or market positioning. In fact, I’ll go out on a limb and say that overemphasizing this dimension may even be ultimately pointless in terms of the eventual project selection. Bear with me here; I’m certainly not dismissing the value of ROI estimates etc. Project managers of one persuasion will claim that a deterministic modeling for all such factors is possible — one recent blog informs us that “One can use either Benefit Measurement Methods (Comparative approach) or Constrained Optimization Methods (Mathematical approach) or both to arrive [at a] conclusion on project selection.”
I agree it is both possible and even desirable in the selection process to have a full and quantified assessment of factors affecting the “SHOULD do” dimension. But here’s my practical experience, again: in the end, the findings of such a model are often ignored, almost arbitrarily. In other words, in many companies of all sizes, the fact of the matter is that politics (and gut) trump spreadsheets: project selection often strays away from sheer issues of ROI or weighted risk calculations and into the realm of a CEO (or other senior executive) simply determining a strategic mandate.
Hence, I recommend not obsessing on honing a deterministic model with intricate weighting and scoring schemes, etc. Instead, as I wrote last time, recognize that there will still be a judgment-based component to project selection, and focus on standardizing the input information to the “SHOULD do” phase to ensure that judgment is maximally informed. Recognize that biases and politics will play some role in project selection, and seek actively at all times to mitigate the effects of such bias. A CEO who really wants to initiate a given project will often do so no matter what the model says; nonetheless, the inputs are still vital.
On the other hand, the “CAN do” dimension aligns the list of projects with what can be accomplished by available resources (I call this “factory capacity“). In essence, it’s meant to provide a way to overcome the natural corporate tendency to take on too much, to “stuff eight pounds of manure into the five-pound bag.” This is one case where you can’t afford to have politics trump spreadsheets. Having determined, through whatever arduous and (no doubt) contentious process, the “vital few” projects of the “SHOULD do” dimension, it is absolutely critical that you achieve success with them. A key way to fail is to take on more than you have resources to do; doing so casts into doubt the success of all projects in the portfolio.
So here’s one relatively quantitative way to proceed. In a nutshell, evaluate whether you’ve “right-sized” your selected project portfolio to your factory capacity by making some over-the-thumb squinting-style estimates for each project, simply classifying each into “T-shirt” size categories. You then link these with general assumptions about the number of hours required for work on a given project in each category. Linked in the Lagniappe section is a sample template spreadsheet, containing three potential templates of varying complexity that you can adopt for such estimating. The goal? To make sure that the projects you’ve picked will be achievable by the resources you’ve got available, based on the assumptions you’ve made about how big projects tend to be. Later, actual analysis and scoping will allow a more precise resource commitment.
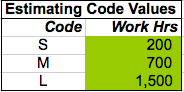
Again, you can make this process very simple or very complex, depending on your needs, inclinations, and patience. Let’s start with a very simple model: three categories of project (small, medium, large). You and your staff should know best, from past experience, how many categories make sense to have, and you should be able to gauge, overall, roughly how many total hours of work are required on average for each size. Include in your scope of consideration all core work of the through-launch development lifecycle: analysis, requirements, design, development, QA, and implementation. These hours will be different for each organization, needless to say.
Also up front, you’ll need to enter your total headcount available for the given period (in my experience, a calendar quarter works well for this planning exercise), in the same work areas. Don’t make the typical error of assuming that each person will be available for forty hours a week (or more): the model includes a productivity factor, currently set at 80%, to account for meetings, sick days, administrative duties, and the like. Remember, this exercise entails rough estimates, and they won’t give you a precise answer or actually do resource allocation.
Then, do a “speed chess” exercise where you estimate, project by project, whether it’s a S, M, or L. This tends to go pretty quickly. Then the fun begins: along with senior stakeholders, you can play “what if” games: a spreadsheet is a great way to include or exclude projects (usually based on your “SHOULD do” evaluated criteria), trying to make as much as possible fit into the bag. In this model, placing an “X” in the “Include in Final Total” column for a given project uses the estimate of hours for that project in calculating the total commitment (with all included projects), and judging whether or not you’re over capacity.
Here’s a look at an example of the most simple model:
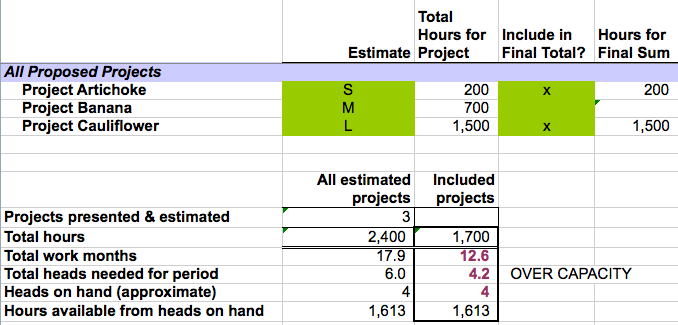
As you can see, the included projects create a total of estimated hours (based on the T-shirt sizing), which is compared to the total hours available from the current headcount. In the above example, the total hours is slightly over what will be available from the current headcount, meaning that you should look for a different mix of projects that will be achievable.
Additional sample templates are included for greater complexity: e.g., more categories (1-5 in the most complex template), or providing for component T-shirt sizing, recognizing that some projects involve little development but intense QA, for example. Picking any of these is vastly better than just shrugging and thinking you can do it by instinct. And it helps all participants understand the undeniable (but often-ignored tenet) that projects really do need to be narrowed to the “vital few.”
Lagniappe:
- Project Estimation sample templates (Excel spreadsheet)

Whilst I like the spreadsheet of sample models the real world challenge that I always face is that each proposed project requires a variety of different skills.
Even the “yet more complex” model assumes that all headcount is equal. The projects that we must evaluate typically require 4 or 5 different skills and thus the current commitments/availability of each different skill set must be compared with resources required for each project.
To make things even harder the current commitments usually have different start and finish dates, so that although a model may indicate that 2 different resources both have sufficient availablity, it may not overlap.
Have you seen any good tools that address these constraints?
Thanks for commenting, Paul. A couple of things to remember about the approach I’m proposing: 1) these are “over-the-thumb squinting-style estimates”, NOT attempts to do fine-grained resource allocation. You’re just trying to get a sense of whether you’re in the ball park of having enough resources to do the set of projects in the hopper, and adjust that list of projects if you don’t. 2) In fact, if you look carefully, the “yet more complex” model does indeed break down resources according to skill set (five different categories of resource, actually)–you can break it down even more, but again, I advise against obsessing over making this model ever more precise and thereby essentially deluding yourself that it’s going to have a higher level of accuracy. Estimates are just that: ESTIMATES.
Finally, and this may be my most critical point, you must adopt this PPM estimating/modeling approach to determine the rough outlook for a given fixed chunk of time (I recommend a quarter). Throw all projects, both new and continuing, for that period into the model, with an estimate of remaining hours provided for each. You’re trying to right-size the entire basket of goods vis-a-vis your resource pool, not micro-plan so that all resource contention issues are solved for each project.
Again, to fully address the constraints you mention would actually be a different exercise: actual resource scheduling, and that typically demands a project management package such as Microsoft Project, Primavera, etc. It also demands significantly more information than you typically can have at an early planning stage. So, I can’t emphasize too strongly that this approach isn’t that, nor do you want it to be.
Peter, thanks for the clarification. I am finding your articles very helpful as we try to design a useable project portfolio management method.
FYI we will be evaluating “daptiv” as a tool to assist with the “can do” estimating. I will let you know how that goes.
One of our objectives is to find a way of presenting the results of “what if” modeling to the key business stakeholders who will actually select the projets. This is something at which we have historically not been very good.
I know of Daptiv (a fine Seattle-based firm) but don’t know the details of their PPM capabilities. I’ll be interested in hearing your impressions. I would, however, advise that you keep the “what if” modeling fairly simple when presenting to stakeholders; more detail can actually backfire and create less clarity. By the way, I hope it was clear that in all the prioritization actions/tools that I’ve been discussing, it’s the STAKEHOLDERS who need to select the projects, juggling the inputs and ramifications as analyzed by IT PMO folks, etc.